Does Rising Global Alcohol Inventory Mean Consumers Have Stopped Drinking? What It Means for Your Restaurant Drinks List (2020–2025) What It Means for Your Restaurant Drinks List (2020–2025)
USD 22 bn of ageing spirits, IWSR’s 1–2% forecast miss for 2024, wine -21%, spirits and RTDs holding up — the market is not “going dry,” it is a mismatch amplified by long-cycle supply × channel destocking × shifting consumption mix. A demand / inventory / shipment-vs-depletion read for restaurants and distributors, plus a “scenario-portfolio” drinks-list strategy.
The current rise in global alcohol inventories — particularly the build-up of "ageing spirits" — does not mean consumers are walking away from drinking. More precisely, the phenomenon stems from a stack of structural factors: post-pandemic demand normalisation, channel-side (wholesale, distributor) destocking cycles, time mismatches between distillery shipments and end-market sales, and the supply-demand lag inherent to long-cycle spirits ageing.
Per IWSR's latest preliminary data release, global Total Beverage Alcohol (TBA) volumes fell roughly 1% YoY in 2024 (released April 2025; figures exclude national spirits). The market is not undergoing a demand collapse, but is instead working through a phased adjustment as it returns to normal and the supply chain rebalances.(1)
According to IWSR, between 2019 and 2024, TBA consumption across the world's top-20 markets declined about 2% versus 2019. The category breakdown is striking: beer down ~2%, wine sharply down ~21%, while spirits and RTDs (ready-to-drink cocktails) are among the few segments still showing relative resilience.(1)
The trend is corroborated by other institutions. The OIV (International Organisation of Vine and Wine) estimates 2023 global wine consumption at roughly 221 million hectolitres (mhl), down 2.6% YoY, and notes that the category has been on a relatively steady downward trajectory since 2018.(2) On beer, Kirin's data shows 2024 global beer consumption at about 194.12 million kilolitres (kL), with prior-year figures revised — reflecting a market in moderate adjustment.(3)
Taken together, the alcohol market is not heading into "broad-based consumption tightening" but into a more granular transition: aggregate demand momentum is slowing, but consumption is shifting from traditional categories toward spirits and RTDs, accompanied by a redistribution of drinking occasions and value preferences.
The much-quoted "USD 22 billion of inventory" has a clearly defined and relatively narrow statistical scope. Per the Financial Times, the figure aggregates the ageing spirits inventory held by five large publicly listed alcohol companies — Diageo, Pernod Ricard, Campari, Brown-Forman, and Rémy Cointreau — based on each company's financial disclosures, and represents the highest level in over a decade.(4)
The key point: this refers to inventory "still ageing in barrels, part of long-cycle production" — not the total inventory across the entire market (channel and end-point). It cannot be read as direct evidence that "consumers have stopped drinking."
What deserves more attention is the gap between shipments and end-market depletions. Diageo, in a recent trading update, explicitly noted that part of its growth came from "the lower-base effect of prior destocking" while still being weighed down by ongoing channel destocking in some markets — in essence: shipments are not the same as actual consumption.(5) Brown-Forman has also repeatedly cited the impact of "net distributor inventory reductions" on reported sales — a textbook destocking cycle.(6)
"Rising alcohol inventory does not equal abstinence; more often it is a 'long-cycle supply × channel destocking' mismatch between shipments and consumption — what really matters is end-market depletion, not distillery inventory."(7)
Methodology and definitions
This report unpacks demand and definitions in turn.
First, on demand: we separate "demand" into volume and per-capita layers, while explicitly acknowledging the differences in statistical scope across data sources. For example, beer is mostly counted in kilolitres (kL), wine in millions of hectolitres (mhl), and overall alcohol consumption is often measured in "litres of pure alcohol" — the three are not directly comparable.
Second, on inventory: we distinguish two structural layers — (A) distillery-side inventory (reflected on the balance sheet, including ageing, work-in-progress, and finished goods); (B) channel inventory (covering distributors, wholesalers, and retailers) — and cross-validate using the language of corporate filings, e.g. shipment vs. depletion gaps and changes in distributor inventory, as key signals for reading channel destocking and restocking behaviour.
Third, on the headline "USD 22 billion": this report takes a careful stance toward such media-friendly numbers, first clarifying their source, statistical scope, and comparability before deciding whether they can be extrapolated as evidence of "weak global alcohol demand," rather than treating them as representative of the whole market.
On key definitions, statistical methodologies across international bodies must also be distinguished:
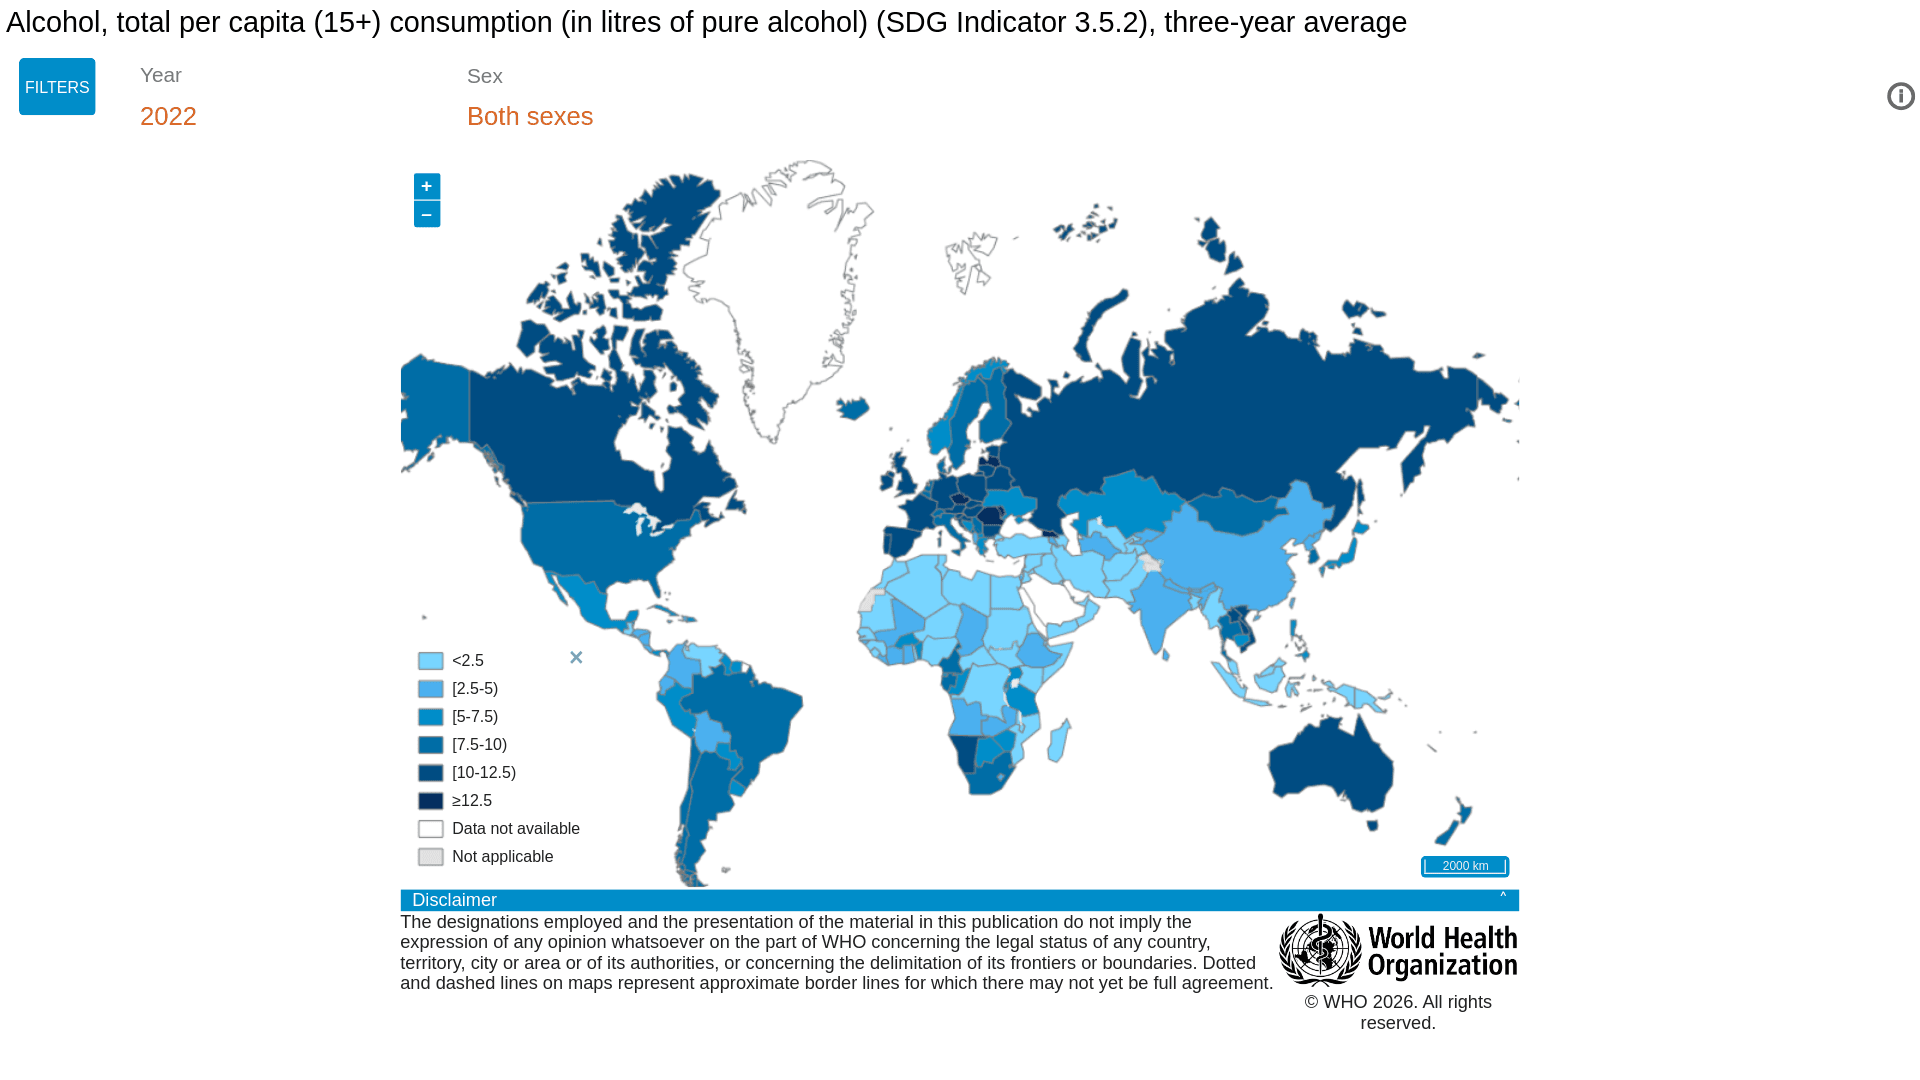
The WHO Global Health Observatory (GHO) defines "Total Alcohol Per Capita Consumption (Total APC)" as: a three-year average of recorded and unrecorded alcohol consumption (ages 15+), adjusted for tourist consumption, expressed in litres of pure alcohol per person per year. The indicator is built to reflect consumption trends, not inventory or channel state.(8)

The OECD's "Alcohol consumption" indicator uses official national statistics on annual sales of pure alcohol (15+), with an explicit caveat: conversion methods differ across countries, and most figures do not adjust for tourism or unrecorded alcohol — so cross-country comparisons must be read with care.(9)
IWSR notes in its methodology that its market sizing uses inventory depletion as the closest proxy for actual consumption, with adjustments for variables such as "residual excess inventory" built into the model.(7) For this reason, when assessing "is anyone actually drinking," this report deliberately separates shipments from depletions, to avoid mistaking supply-chain behaviour for changes in consumption.
Lastly, on data handling: where complete year-by-year data for 2018–2025 is not available from public sources, we substitute the "most recent available year" with explicit timestamps. All data is also tagged by source type — "official statistics" vs. "industry estimate / projection" — to flag relative reliability and usage caveats.
Demand-side data and trends
Global aggregates and category structure
According to IWSR's preliminary data released in April 2025, 2024 global Total Beverage Alcohol (TBA) volume fell roughly 1% YoY (excluding national spirits), with major markets — including the US, China, India, and Europe — all undershooting prior expectations.(1) Critically, the report notes that actual volumes came in roughly 1–2% below the original forecast, equating to a gap of more than 300 million 9-litre cases.(1) This "forecast gap" matters: with supply chains already tight or post-expansion, even a 1–2% demand miss is enough to put significant pressure on system-wide inventory and turnover.
Translated into actual volume: 300 million cases is roughly 2.7 billion litres, or about 3.6 billion bottles (at 750 ml). At that scale, this is essentially potential inventory stranded in channels or distillery systems, not a mere statistical noise.
By category, wine's structural decline is clearest. The OIV (April 2024, reviewing 2023) estimates 2023 global wine consumption at roughly 221 mhl, down 2.6% YoY, and notes a sustained downward trajectory since 2018. Within that, China alone has averaged about 2 mhl in annual losses since 2018, layered with the 2020 pandemic shock and 2022 inflation pressure — accelerating the slide.(2)
Beer, by contrast, shows a "decline-then-rebound" pattern. Kirin's data has global beer consumption moving from ~188.79 million kL in 2018 and 189.05 million kL in 2019 down to 177.50 million kL in 2020, before recovering to roughly 194.12 million kL by 2024. Drinking behaviour did not vanish — but the pandemic clearly reshaped consumption structure and supply-side forecasting.(3)
The takeaway: today's key question is not "does demand still exist," but by how much does demand miss expectations. That seemingly small 1–2% gap, amplified through long-cycle production and multi-tier channels, is the root of inventory build-up and supply-demand misalignment.
Available indicators by market
The table below prioritises "official / semi-official sources (OIV, company filings)" and "industry research (IWSR, WSWA)"; gaps are marked N/A.
Market: Global TBA volume trend (available): 2024 TBA approximately -1% YoY (excl. national spirits); 2024 came in 1–2% below forecast (>300M case gap)(1) Wine consumption (OIV, 2023): 221 mhl (-2.6% YoY)(2) Other verifiable signals (category/behaviour): Beer 2024 ~194.12M kL (Kirin)(3) Data type: Industry estimate + official statistics
Market: United States TBA volume trend (available): IWSR-cited: 2024 TBA approximately -3% YoY(10) Wine consumption (OIV, 2023): 33.3 mhl (-3.0% YoY)(2) Other verifiable signals (category/behaviour): WSWA SipSource: 2024 spirits depletions approximately -3.7% (year-end summary)(11) Data type: Industry estimate + official/company disclosure
Market: China TBA volume trend (available): IWSR-cited: 2024 TBA approximately -5% YoY; -4% in some segments (different scope)(10) Wine consumption (OIV, 2023): 6.8 mhl (-24.7% YoY)(2) Other verifiable signals (category/behaviour): Wine decline is one of the core drivers of global weakness (OIV: ~2 mhl in annual losses since 2018) Data type: Industry estimate + official statistics
Market: United Kingdom TBA volume trend (available): (Public year-by-year TBA totals 2018–2025 insufficient; using category/behaviour indicators instead) Wine consumption (OIV, 2023): 12.8 mhl (-2.9% YoY; 5th largest globally)(2) Other verifiable signals (category/behaviour): FT, citing IWSR: UK adults average 10.2 drinks/week, down >25% from peak (more "moderation" than abstinence)(12) Data type: Industry estimate + official statistics
Market: European Union TBA volume trend (available): (Public year-by-year TBA totals insufficient; using OIV's EU industry macro indicators instead) Wine consumption (OIV, 2023): (This OIV report does not give EU-wide consumption; major-country aggregate requires separate OIV annual report/database)(2) Other verifiable signals (category/behaviour): OIV: 2023 EU vinified production ~144.5 mhl (-10.6% YoY); vineyard area ~3.3 mha (-0.8%)(2) Data type: Official statistics
Market: India TBA volume trend (available): IWSR notes India among markets undershooting expectations (2024); structurally spirits-heavy (53% of TBA), but the category mix is shifting(1) Wine consumption (OIV, 2023): (OIV does not list India among major wine markets)(2) Other verifiable signals (category/behaviour): IWSR / industry media remain bullish on India growth and "Indian whisky" highlights, but public year-by-year quantitative data remains thin(1) Data type: Industry estimate
Important caveat: if you are trying to judge whether your local restaurant scene / distributor base has "stopped drinking," looking only at "industry-wide inventory" is dangerously misleading. "High inventory + selected SKUs going out of stock" can coexist at the same time (especially for long-cycle spirits).(13)
Source: Kirin global beer consumption statistics for 2018, 2019, 2020 and 2024 (some years missing; series is non-continuous).
Inventory side: where the USD 22 billion comes from, channel destocking, and days-of-inventory
Source of the "USD 22 billion" headline
The most traceable and best-defined source for "USD 22 billion" comes from the Financial Times (January 2026). The FT reports that five large publicly listed alcohol companies — Diageo, Pernod Ricard, Campari, Brown-Forman, and Rémy Cointreau — collectively hold roughly USD 22 billion of ageing spirits inventory, the highest level in over a decade, aggregated from each company's financial disclosures.(4)
Crucially, the figure has a clear and limited scope:
Company scope: A specific set of five large international alcohol companiesCategory scope: Ageing spirits only (not all alcohol categories)Accounting basis: Typically booked at cost basis, not market valueThe right use of "USD 22 billion," then, is to read it as an indicator of capital tied up in spirits and the long-cycle supply pressure — useful for understanding supply-demand mismatch and inventory build-up — not as direct evidence of "weak global alcohol demand" or "consumers no longer drinking."
Days of inventory at distilleries
For distributors and importers, "days of inventory" is more intuitive than "inventory value" (since value is heavily distorted by pricing, FX, and SKU mix). The figures below are computed from public financials (simplifying assumption: average inventory ÷ period Cost of sales × 365):
Company: Diageo Fiscal year (reporting date): FY2024 (2024/06/30) Total inventory (period-end): 9,720 (USD m) Of which ageing/long-cycle: Maturing 7,832 (USD m); ">1-year-available" maturing 5,885 (USD m) Cost of sales: 8,071 (USD m) Estimated days (total inventory): ~438 days Estimated days (ageing/long-cycle): ~342 days
Company: Pernod Ricard Fiscal year (reporting date): FY2025 (2025/06/30) Total inventory (period-end): Net inventories 8,418 (EUR m) Of which ageing/long-cycle: Ageing inventories 7,099 (EUR m); 84% of total inventory Cost of sales: 4,443 (EUR m) Estimated days (total inventory): ~685 days Estimated days (ageing/long-cycle): ~564 days
Company: Brown‑Forman Fiscal year (reporting date): FY2024 (2024/04/30) Total inventory (period-end): Inventories 2,283 (USD m) Of which ageing/long-cycle: Barrels 1,490 (USD m) Cost of sales: Reported as ~USD 1.7 bn Estimated days (total inventory): ~519 days (estimate) Estimated days (ageing/long-cycle): ~295 days (estimate)
What this table shows: under normal conditions, the spirits industry inherently maintains inventory at a "hundreds-of-days" scale. In-barrel ageing is a structural part of supply capacity, not unsold dead stock.
So "high inventory" does not automatically signal risk. The conditions that turn it into pressure are two: when inventory exceeds the reasonable ageing-pipeline level, and sales momentum cannot replenish it. Only then does it translate into financial and market pressure — including rising capital-tied-up costs and a wider risk of price competition.(4)
Channel inventory: how destocking can make sales look weak
Channel destocking typically plays out when supply chains shift from "expansion" to "contraction."
During the pandemic and the early reopening period, distributors and wholesalers actively raised inventory levels to avoid stockouts and secure allocations. But as interest rates rose, financing costs climbed, and end-demand levelled or softened, channels began pulling inventory back to more reasonable target ranges. This adjustment opens up a key observation gap:
End consumption has not necessarily dropped sharply, but distillery-to-channel shipments fall meaningfully.
The result: reported "sales" look weak and inventory looks like it is piling up — when in reality, restaurant and retail sell-through may simply be returning to normal from a peak, not collapsing.(7)
Verifiable corporate cases
Take Diageo: its FY25 Q3 trading update flags two key signals at once:
Part of its growth came from "the lower-base effect from prior destocking," while ongoing destocking in some markets continues to weigh on the numbers.It then unpacks the gap between depletions, consumption, and shipments across supply-chain layers.(5)
Brown-Forman's filings follow the same logic — repeatedly highlighting the impact of "net distributor inventory reductions" on net sales by region — a textbook example of how destocking cycles strain reported figures.(6)
Drivers and quantitative analysis
The post-pandemic "high inventory" picture is not driven by a single cause; it is the result of multiple factors stacking. Five primary drivers can be identified:
Demand pullback and "forecast error": the amplifier of long-cycle supplyDrinking demand briefly spiked during the pandemic, prompting distilleries to expand capacity and accelerate barrelling. As demand normalised, actual volumes came in below expectations. IWSR notes that 2024 global TBA volumes were 1–2% below forecast (a gap of more than 300 million cases), with the US, China, India, and Europe all undershooting.(1)
That seemingly modest miss is especially harsh on spirits, where supply decisions (distillation, barrelling) are made years — sometimes a decade — in advance. Once forecasts go off, the deviation gets amplified at the inventory layer. The FT lays out the same chain explicitly: pandemic-era demand surge → distillery expansion → demand cooling → inventory build-up — calling it an "unprecedented" pile-up of stock.(4)
Higher cost of capital and channel destocking: the gap between reports and realityIn a high-rate environment, inventory carrying costs rise sharply, pushing wholesale and retail channels to actively reduce inventory levels. The classic pattern follows: shipments drop noticeably while end-market depletion does not fall in step.
In other words, corporate filings look weak — but actual consumption may simply be returning to normal. Diageo's "retailer inventory destocking" language in its trading updates is a textbook example of this mechanism.(13)
Category-mix shift: demand is not disappearing, it is rotatingBy category, the shifts are clearly structural. IWSR notes that since 2019, wine has fallen the most (~-21%), spirits and RTDs have been relatively resilient, and no-alcohol has grown strongly.(1)
So the market is not "abstaining" — it is "changing what people drink." The implication for inventory: if companies overweight the wrong category (e.g. some high-end cognac or tequila), they create localised inventory pressure — even a "category-mismatch" inventory bubble.
Younger generations and "moderation": demand structure rebalancingIn some mature markets, younger consumers are shifting toward more moderated drinking patterns.( The UK is a leading example: the FT, citing IWSR, notes alcohol consumption is at its lowest since 1990 — but the change reads more as "drinking less" than "not drinking."
These structural shifts hit high-frequency, low-price categories first, while premium products may rotate further upmarket. The result: companies face higher decision complexity around volume and product mix, making inventory adjustments more delicate.(12)
Policy and substitutes: regional, not uniformPolicy and substitutive consumption (e.g. cannabis legalisation, weight-loss drugs) are also potential variables, but their effects are highly region-specific and directionally mixed.
In the US, JAMA Health Forum research finds recreational cannabis legalisation is weakly positively correlated with "any drinking" but shows no significant impact on binge / heavy drinking — suggesting it can act as both substitute and complement, depending on drinking pattern.(15)
Separately, a JAMA Psychiatry randomised trial finds semaglutide (a weight-loss drug) may affect alcohol intake and craving (sample size and external validity remain caveats). Overall, these factors are more likely to affect specific cohorts (e.g. heavy drinkers) and local markets, rather than directly explain the global inventory build-up.(16)
Quantitative breakdown: how much "excess inventory" can demand softness explain?
One key premise first: USD 22 billion refers to "the total stock of ageing spirits inventory," a substantial portion of which is normal-course inventory required to keep operations running.
This report therefore uses two analytical lenses to define the relationship between "inventory" and "excess":
Lens A: treat USD 22 bn as "all excess"
Treating the full USD 22 bn as excess inventory leads to a biased conclusion — it understates the explanatory power of the demand side. The reason: ageing spirits by their nature require large inventory as part of normal operations, so the absolute number is not the same as excess.
Lens B: define excess as the "incremental delta"
The supply-chain- and finance-aligned approach is to define "excess" as the inventory increment versus pre-pandemic or normal years.
Take FT's figures: Diageo's ageing inventory as a share of annual revenue rose from 34% in FY2022 to 43% in FY2025. Treating that move as a proxy for "excess intensity":
Excess share ≈ 1 − (34 / 43) ≈ 21%
Applying that ratio to USD 22 bn yields a potential excess scale of ~USD 4.6 bn (this is an analytical estimate, not a precise number).
What demand softness can plausibly explain
Now estimate the demand-side impact (using the IWSR 2024 forecast gap of >300M cases as the basis):
Using Diageo FY2024 cost structure (Cost of Sales ~USD 8.071 bn) as a reference, rough cost per 9-litre case is ~USD 35So a 300M-case demand gap corresponds to roughly: ~USD 10.5 bn of cost-side magnitude
Caveats:
This is an all-category gap (not just spirits) and not all of it directly translates into ageing inventoryIf we further assume 30%–60% of that gap maps to spirits / RTD-related categories, then:
Demand-side cost-side magnitude ≈ USD 3.2–6.3 bn
Key cross-check
"Excess" estimated under Lens B: ~USD 4.6 bn. Demand-gap explanatory range: USD 3.2–6.3 bnThe ranges overlap heavily, which means:
A mere 1–2% demand miss, combined with channel destocking, is enough to be amplified on the books and at the inventory layer into what looks like a serious "inventory problem."
Driver of "excess ageing inventory": Demand below expectations (incl. structural moderation) Estimated share: 35%–60% Reasoning: IWSR 2024 forecast gap of 1–2% (>300M cases) is enough to amplify inventory; UK and similar markets show long-term moderation(1)
Driver of "excess ageing inventory": Channel destocking (shipments < depletions) Estimated share: 25%–45% Reasoning: Filings and trading updates frequently cite destocking; distributor inventory swings rewrite shipments(13)
Driver of "excess ageing inventory": Post-pandemic capacity expansion / overproduction (supply leading demand) Estimated share: 15%–30% Reasoning: FT describes pandemic-era expansion followed by demand cooling; ageing spirits cannot be stop-lossed quickly(4)
Driver of "excess ageing inventory": Ageing cycle / category characteristics (adjustment lag) Estimated share: Accelerator, not standalone driver Reasoning: Ageing inventory is long-cycle by nature; short-term production cuts cannot make existing stock disappear(17)
How to read it: deciding "is anyone drinking" requires separating "demand factors" from "channel factors." Most of the time, it is "channels returning to a sensible inventory level" causing short-term shipment declines — not consumers suddenly stopping.
Conclusion
The common narrative is "global alcohol demand is falling, young people are not drinking, and that is why distillers are sitting on inventory."
The more accurate read: the market is not a simple demand collapse, but is being shaped by two forces at once — a demand-side "consumption-mix shift" and a supply-side "inventory and production-cycle adjustment" (including channel destocking and supply-cycle mismatch). On the demand side, aggregate volume in some mature markets has indeed slowed, but it has not vanished — it is rotating clearly toward low-alcohol, no-alcohol, RTDs, and different drinking occasions. At the same time, distillery shipment declines are largely driven by channel destocking, not parallel drops in end-market consumption. As for the much-cited "USD 22 billion of inventory," it is mainly the major distillers' ageing-spirits assets, reflecting a capital and production-cycle problem more than the market grinding to a halt.
For restaurants and distributors, this means the priority is not "shrinking the drinks list" but "rebuilding the drinks-list logic." Rather than betting on a single big category (e.g. doubling down on wine or on a single spirit), a more effective approach is to rotate to a "scenario-portfolio" strategy: a three-tier mix of "low/no-alcohol + RTD/Highball + classic spirit-led cocktails," mapped to different consumer motivations (moderation, casual, social). Given the IWSR-flagged trend of resilient spirits/RTDs versus pressured wine, this kind of structural adjustment is not just SKU optimisation — it is the working angle that lets you keep order rates and average ticket up in an environment where people "drink less but pickier." The fastest way to put a three-tier drinks list in front of guests is to make it orderable at the table: use Eatsy's online ordering and reservations to package low/no-alcohol, RTDs, and signature cocktails as one-tap add-ons, then let the order data refine the list. The fastest way to put a three-tier drinks list in front of guests is to make it orderable at the table: use Eatsy's online ordering and reservations to package low/no-alcohol, RTDs, and signature cocktails as one-tap add-ons, then let the order data refine the list. The fastest way to put a three-tier drinks list in front of guests is to make it orderable at the table: use Eatsy's online ordering and reservations to package low/no-alcohol, RTDs, and signature cocktails as one-tap add-ons, then let the order data refine the list.
🔗 Read more — and see how Eatsy helps restaurants turn a drinks-list rethink into table-side orders: link to the reservations/ordering product page and 1–2 related menu-strategy posts. — and see how Eatsy helps restaurants turn a drinks-list rethink into table-side orders: link to the reservations/ordering product page and 1–2 related menu-strategy posts. — and see how Eatsy helps restaurants turn a drinks-list rethink into table-side orders: link to the reservations/ordering product page and 1–2 related menu-strategy posts.
- Post-Pandemic Inbound Tourism Trends and the 2025 Restaurant Marketing Playbook
- Taiwan Restaurant Industry 2024–2026 Deep Dive: Nominal Growth, Demand Redistribution, and Structural Squeeze
- 2025 Taiwan Restaurant Industry Trends Report
- Best Restaurant Reservation Systems Taiwan 2026: 6 Options Side-by-Side