2026 Taiwan Restaurant Industry: 5 Signals for Independent Restaurant Owners
NT$909.7 bn restaurant industry, +7.5% nominal, ~4% real, dining-out CPI +3.4%; 14,236 convenience stores, USD 1.4 bn ready meals, USD 1.44 bn online delivery, super-aged society at 20.06% — the market is still growing, but growth is "narrowing." This report uses official statistics and industry research to unpack demand redistribution, the supply-side squeeze, the efficiency / experience / trust segmentation, and a five-point playbook for independent restaurant operators.
Executive summary
Looking at 2024–2026 (as of 2026/03/25), the core phenomenon in Taiwan's restaurant market is not "no growth" — it is that "the source of growth has changed." Based on the Department of Statistics' monthly series (Wholesale, Retail and Food Service revenue), 2024 restaurant industry revenue was NT$1.03 trillion(1), rising to NT$1.07 trillion in 2025, +2.9% YoY.(2) But if we look at "restaurant industry scale" as compiled by industry research bodies, 2025 scale is roughly NT$909.7 billion, +7.5% nominal YoY, while the dining-out CPI is +3.4% — implying real growth of ~4.0% after inflation. In other words, revenue growth comes from both higher prices and rising demand in roughly equal contributions, indicating growth is not primarily driven by a sharp increase in dining frequency.(3)
Consumer behaviour is redirecting the traditional "one meal" toward three at-scale alternative markets: high-density convenience stores (over 14,000 outlets; one store per ~1,600 people)(4), the ready meals / ready-to-eat market (estimated at ~USD 1.4 bn in 2024)(5), and the online delivery market (estimated at ~USD 1.44 bn in 2024)(6). At the same time, the population formally crossed into a "super-aged society" by end-2025 (those aged 65+ at 20.06%)(7), raising the weight of "time-saving, predictable, affordable" in everyday meal decisions.
On the supply side, operators face the textbook "high-cost + high-volatility" squeeze: ingredient and labour pressure are still the most-reported business pain points (ingredient cost volatility 66.4%, labour shortage 62.8%, high turnover 57%, personnel costs up 7.4% to 58.5%, etc.)(8). The Ministry of Labour's job-vacancy survey also shows a 4.6% entry rate and 5.0% exit rate in food service(9) — the structural problem of "easy to hire, hard to retain."
So the next few years are not "an across-the-board good time for restaurants" — competition will concentrate at two ends: high-frequency essential demand (affordable, fast, standardised) and purpose-built experience (clearly narrated, clearly differentiated) will more easily absorb the limited incremental demand. The biggest challenge falls on "middle-tier, homogenised, no-clear-value-prop" restaurants.
The core observation: nominal growth still exists, but "volume" growth is slowing
Putting the "headline numbers" on the same table: the DGBAS reports 2024 full-year CPI at +2.18% YoY and 2025 full-year CPI down to +1.66%. Overall inflation cools, but that does not equal the public's felt cost-of-living going down in step. One reason: dining-out costs remain sticky. The DGBAS noted in its December 2025 price commentary that dining-out cost increases have been above 3% for 14 consecutive months(10) — these high-frequency outlays drive a strong sense of "felt inflation."
Mirai Research's annual structural data offers a closer "nominal vs real" read: 2025 restaurant industry scale of NT$909.7 billion, +7.5% nominal YoY; same-year dining-out CPI +3.4%(11). Using that as the price deflator, real growth is roughly 4.0%. The point is not "the 4% number itself" but the direction it implies: a meaningful share of revenue growth is coming from prices, and in an environment where substitutes are multiplying, fully passing costs through "raising prices" is hard — so competition diverges faster.
Threading these indicators together gives a more robust conclusion: the restaurant market is still growing, but growth is "narrowing." That is, incremental revenue is more likely to concentrate in the formats that absorb high-frequency demand or that clearly define their value; the large mass of "homogenised, dependent-on-walk-ins, dependent-on-table-turn" middle-tier restaurants is not facing a single business cycle — it is facing a structural change in consumer habit.
Demand redistribution: how three substitute markets are dividing dining-out demand
If you only see the 2024–2026 restaurant competitor as "a new place opened next door," you are underestimating off-court forces. More crucially, how consumers solve "one meal" is being rewritten by three markets: convenience-store fresh food and life-node networks; ready meals (frozen ready-to-cook, chilled ready-to-eat); and the "convenience-commoditisation" of delivery platforms.
The first is convenience-store density. The Department of Statistics, in its CVS-related statistics, notes 13,706 stores at end-2023 (one per 1,703 people on average); by August 2025, the national CVS count rose to 14,236, one per 1,659 people on average(12) — density still climbing. The point is not "a few hundred more stores" — within commute lines and life radii, consumers can more easily replace "going to a restaurant" with "grabbing a ready-to-eat meal nearby." Fresh food becomes a "low-friction option" that systematically cannibalises some daily dining-out occasions, especially lunch, late-night, and impromptu overtime — all high-time-pressure scenarios.
The second system is ready meals / ready-to-eat. The biggest difficulty here: Taiwan does not have an officially fixed "ready-meals market size" total, so we must rely on research-house estimates. Per Deep Market Insights' public page, Taiwan Ready Meals 2024 size is ~USD 1.4 bn, with a 2025–2033 CAGR forecast of ~5.96%. (5) We do not need to treat each estimate as a precise answer, but it gives a directional signal: ready meals' growth is not just "replacing some dine-in" — more importantly, it pushes meal supply toward an industrialisable, channelable commodity form, further reinforcing the competitive edge of "stable, fast, standardised."
The third system is online delivery. Delivery similarly lacks an official unified market size, so this report uses estimates and flags the methodology gap. Deep Market Insights estimates Taiwan online delivery 2024 size at ~USD 1.44 bn with a 2025–2033 CAGR of ~10.43%. (6) Delivery's structural impact is shifting "exposure entry points" from street-level visibility to in-app ranking, ratings, and promo placement. For operators, that means even when delivery growth slows, channel power can still rise; for consumers, "convenience" is more cleanly priced and commoditised (platform fee, delivery fee, surcharges).
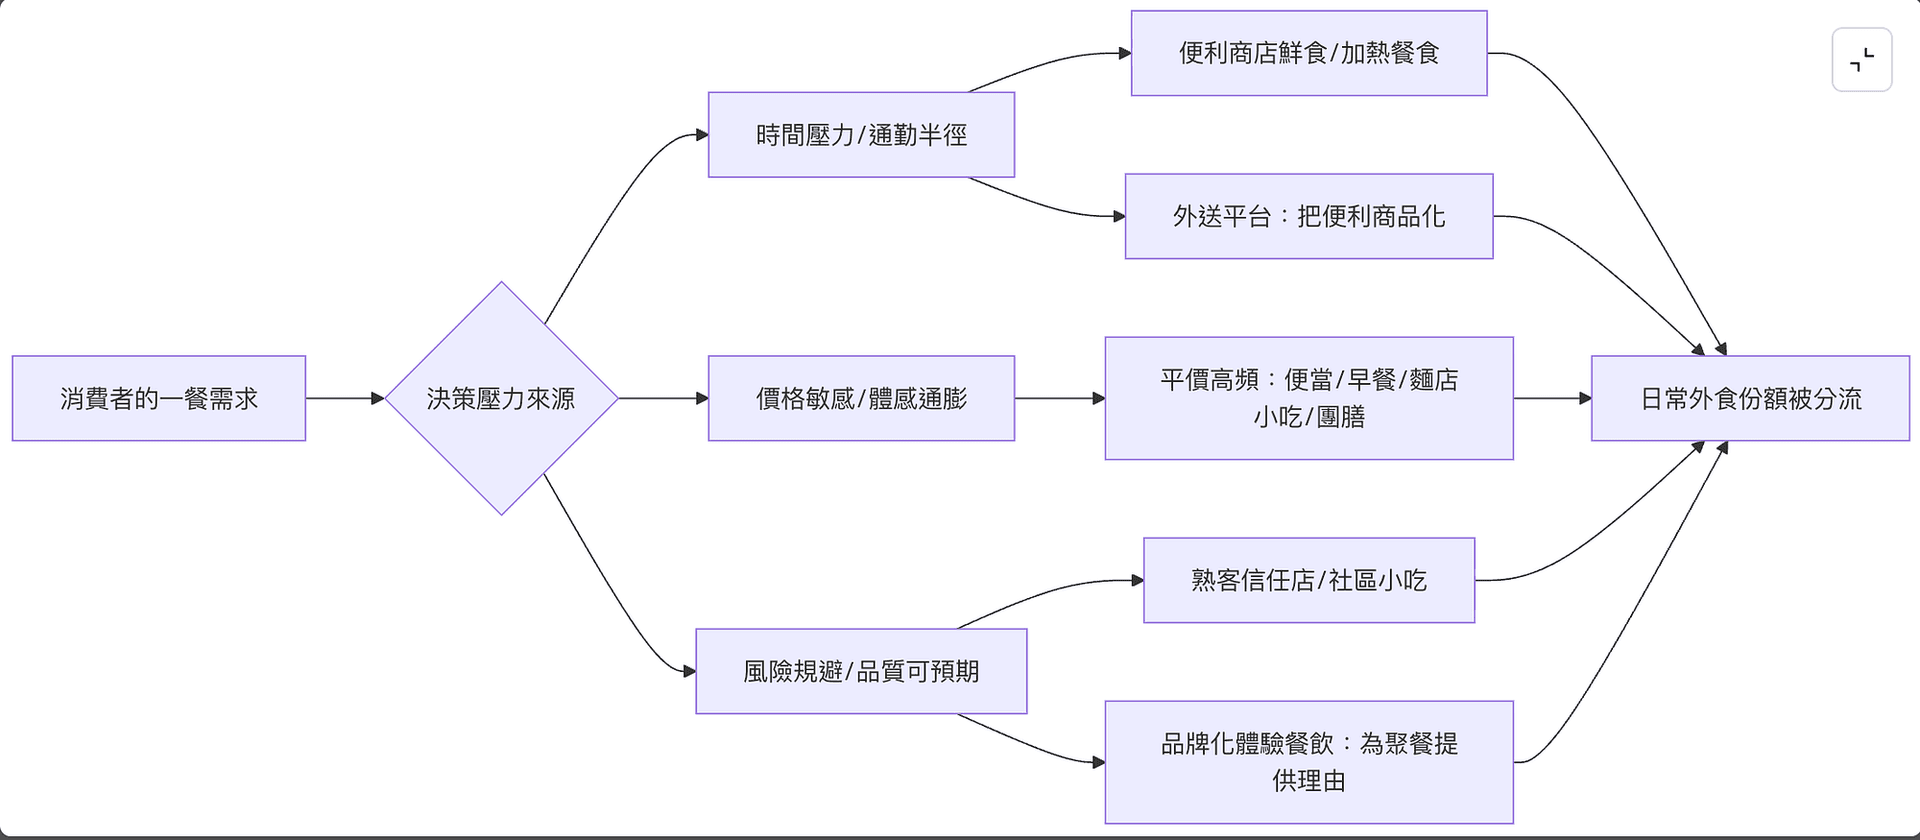
Layering these three substitute systems on top of the 65+ population reaching 20.06% by end-2025 (formal entry into a super-aged society) makes it clearer why "time-saving, predictable" becomes a high-weight criterion in everyday meals: ageing and small-household structures often come with more fragmented eating needs, plus a preference for meal consistency and access convenience.
The diagram below uses a simplified flow to show the logic of "demand redistribution." It is not an official taxonomy — it is a way to organise the fragmented phenomena into an actionable causal chain.

Supply-side squeeze: labour, costs, and industrialisation
Demand being diverted does not necessarily mean "restaurants cannot survive." The real squeeze comes from rising supply-side costs that cannot be passed through at the same speed.
First, costs and operating pain. The Department of Statistics' operations survey shows operators most often report pain points centred on ingredients and labour: ingredient cost volatility (66.4%), labour shortage (62.8%), high turnover (57%), personnel costs too high (58.5%), intense competition among peers (53.3%)(8). The value of these percentages is that they are not one operator's complaint — they point to "a pressure structure most operators share": ingredient price and supply uncertainty, plus a tight labour market and rising retention costs.
Second, labour flow. The Ministry of Labour's job-vacancy survey, March 2025 (ROC 114), shows: accommodation and food service vacancy rate 4.4%; for restaurants specifically, entry rate 4.6%, exit rate 5.0%(9), with the explicit note "many willing to enter, but many also leave; retention is hard." The takeaway for operators is direct: in a high-flow environment, costs are not just wages — they are recruitment, training, errors, and quality variance; and "flow" itself frequently degrades customer experience, generating a second wave of pressure.
Against this backdrop, the supply-side response tends toward "standardisation and tooling." The Department of Statistics has also observed operators actively adopting digital transformation: e-invoicing (80.0%), POS deployment (77.7%), and mobile payment (61.2%) all run high; in addition, online ordering (41.2%), online reservations (39.9%), plus floor-process tools like tablet ordering (41.9%), serving robots (17.7%), and self-checkout (5.8%) show that "using tech to cut labour load and reduce errors" has moved from optional to standard.(13)
On the supply chain, mature cold-chain and logistics raise the volume of "transportable meal commodities." Mirai Research estimates Taiwan's cold-chain logistics 2023–2028 CAGR at ~6.9%, with industry scale heading toward NT$120 bn; food (chilled fresh, frozen) is the main delivery category. Cold-chain expansion does not directly equal "fewer restaurants," but it does let more meals cross distance with stable quality, further reinforcing the supply capability of CVS, hypermarkets, e-commerce, institutional catering, and delivery — putting long-term competitive pressure on the "made-to-order on-site only" model.(14)
Market segmentation and implications: which formats are more likely to survive, which face greater challenges
To judge who will be a 2026 "winner," you cannot just split "chain operators vs. independents." A more actionable cut: in different occasions consumers buy different core values, and restaurant supply is splitting along three value propositions — efficiency, experience, and trust. This is not a moral judgement — it is a survival framework for the post-redistribution landscape.
Efficiency type: core value is "time-saving" and "highly predictable."
Mirai Research's 2025 food-service structural data shows industry expansion clearly concentrating in affordable, essential-demand formats:
Bento / cafeteria, on top of a high 2024 base (+21.7%), still posted +22.1% YoY in 2025; breakfast shops +16.4%, noodle / street-food +12.9%, and institutional catering / staff meals +12.6%.(11)
The common thread for these formats: per-transaction margin may not be standout, but through high-frequency consumption, process standardisation, neighbourhood-level location strategies, and replicable supply modules, they keep absorbing the bulk of the incremental "everyday meal" demand under inflation pressure and demand diversion.
Experience type: core value is "providing a reason to gather" and "emotional value."
Mirai Research notes "general restaurants" remain the largest sub-category in food service, 49.6% of the industry in 2025, with revenue movement that is highly indicative for the overall industry climate.
The point here is not "experience-type is growing faster" — it is that, in an environment where dining-out prices stay elevated and dining frequency may turn cautious, consumers more readily concentrate budget on "a meal with clear value."
So the key for experience-type is not just the product itself — it is whether you can build a clear value narrative — covering menu design, service flow, spatial atmosphere, and thematic pacing — converting consumption from "eating a meal" to "completing one consumption experience."
Under this structure, the experience-type market still has a base load, but the competitive logic shifts from price competition to brand and content.
Trust type: core value is "familiarity," "low risk," and "geographic relationship."
This format is common among neighbourhood eateries, regular-customer haunts, and family-run restaurants. Its edge: when consumers want to lower decision cost, "the known and stable choice" is itself attractive — making repurchase rate the most important competitive moat.
Compared with the efficiency type's reliance on process and the experience type's reliance on content, the trust type relies more on long-term relationship accumulation. Demand here is not from one-shot pull — it is from the habit of repeated consumption.
Its structural limits, however, are equally clear: under labour scarcity, succession uncertainty, and limited standardisation, this format usually struggles to scale and amortise rising costs, with growth and resilience tightly bound to the individual operator's ability and local relationships. To make these three segments easier to use in strategy discussions, the table below puts "profit profile, scalability, channel dependence, and weak points" of all three on one matrix. These are inferential summaries — meant to help operators self-position.
Note: The figures below are based on industry observation; actual results vary by shop and are provided for decision reference only.
| Dimension | Efficiency (fast / high-frequency) | Experience (gathering / content) | Trust (local / regulars) |
|---|---|---|---|
| Main demand driver | Time pressure, price-sensitive, predictable | Social occasions, ritual, emotional value | Familiarity, low risk, geographic relationship |
| Margin profile (typical) | Thin per ticket; relies on turn and standardisation | Thicker per ticket; relies on experience premium | Mid-range; relies on repurchase and word of mouth |
| Scalability | High (process / supply chain replicable) | Mid (brand replicable but on-site demand high) | Low to mid (people and place tied) |
| Channel dependence | Mid to high (takeaway / delivery scales volume) | Mid (use platforms to drive but route to owned) | Low (mostly regulars / neighbourhood flow) |
| Biggest weakness | Margin eaten quickly when costs rise | Average ticket and footfall swing in downturns | Succession, labour, demographic shift |
For a more "statistical" structural read, the Department of Statistics also provides sub-industry breakdowns (restaurants, beverage shops, catering / institutional contracting).
Per the Department of Economic Affairs' food-service revenue structure for 2025: the restaurant sub-industry remains the absolute backbone, at ~80% of total revenue; beverage shops ~10%+; catering / institutional contracting ~5–10%.
This split does not directly correspond to "efficiency / experience / trust," but it provides one important structural signal:
the overall market is still led by "restaurants"; beverage shops have formed a meaningful independent track; and catering / institutional commercial partnerships, in specific regions and industry clusters, offer relatively cycle-resilient stability.
An honest read on independent restaurants — and what to do about it
Independents are not "destined to lose" — but in the coming environment, running one looks more like a startup with a higher bar: competition is not just other restaurants — it is convenience stores, the ready-meal supply chain, and the conjoined system of delivery platforms and logistics. Against that backdrop, the win-rate of "hold on until the cycle turns" goes down — because the pressure is mostly structural, not cyclical.
Based on the data and trends above, more grounded advice for independents is to converge operations around three to five risk-reducing actions:
First, define what your shop actually sells: efficiency, experience, or trust. 2025 growth concentrated in bento / breakfast / street food / institutional catering — affordable essentials — meaning efficiency-type has real incremental demand; general restaurants still hold the largest market, meaning experience-type has not vanished; trust-type leans on returning customers for resilience. Refusing to pick a side leaves you stuck in "middle-tier homogenisation" — the easiest target for substitution from both ends.
Second, treat "labour flow" as a Tier-1 KPI, not a management problem to handle after the fact. With food-service entry rate 4.6% and exit rate 5.0%, every hire likely overlaps with someone leaving; process decomposition, smoothing peak workflows, and using digital tools to cut error cost are often more effective for retention and stability than pure pay rises.
Third, treat digital as a "friction-reducer," not a trend to follow. By overall adoption, e-invoicing, POS, and mobile payment are baseline; the tools that actually move labour load and table-turn efficiency are front-of-house — online ordering, self-checkout, online reservations — and whether they fit depends on your guest mix and peak shape.
Fourth, redesign your product mix for the reality of "everyday meals being diverted." CVS density and ready-meal growth will keep eating into some of the daily dining-out base; an independent that targets "everyday" must give a clear reason "to be more worth it than a CVS" (category specialisation, predictable portion / flavour, speed of plating); an independent that targets "experience" should sidestep direct competition and shift the pitch to "on-site value you cannot get without being there" (atmosphere, service, hot-plate presentation, social occasion).
Fifth, in an environment of nominal growth but real-term slowdown, pricing has to be more precise. Mirai uses dining-out CPI as the price proxy and gets ~4% real growth in 2025 — meaning "across-the-board price hikes" more easily push price-sensitive customers into substitute systems. The more controllable approach: concentrate price increases on the most-differentiated, hardest-to-substitute items or experiences, and use specifications and combo pricing on the rest to defend the margin. Add a short closing paragraph before the 'Read more' list that bridges the trends to a concrete next step for the reader, e.g. 'If you compete on experience or trust, the cheapest defence against lost covers is protecting the bookings you already have — estimate your exposure with the no-show loss calculator below.' Then keep the existing link list (which already includes the no-show and reservation-TCO tools).
- Post-Pandemic Inbound Tourism Trends and the 2025 Restaurant Marketing Playbook
- 2025 Taiwan Restaurant Industry Trends Report
- Best Restaurant Reservation Systems Taiwan 2026: 6 Options Side-by-Side
- Scarcity, Autonomy, and Neuroeconomics: Decoding Consumer Psychology Across Restaurants, Hospitality, and Entertainment
- No-show loss calculator
- Reservation system TCO calculator